Netflix’s Strategy & Consumer Dynamics

- SECONDARY RESEARCH
- IDEA & DATA VISUALIZATION
- VISUAL STORYTELLING
Project:
Group Project (4 Members )
Responsibilities:
Researcher, Data Visualizer, Video Creator
Duration:
4 Weeks
The Project
Secondary research involved converting data into 2D models to effectively comprehend and summarize strategies, challenges, and recommendations for Netflix. The team utilized fast sketching and data visualization tool kit to craft impactful narratives for the company.
Data visualization is the bridge between data and understanding. It is not just about making pretty charts; it’s about transforming raw data into compelling narratives that inspire action and drive strategy.

Research – Data Synthesis – Data Translation – Concept Pitch – Developing The Slide deck – Poster Design – Movie

Developing the Narrative.
The storyboard was further translated into th n where we re-designed the data and translated it into graphs.
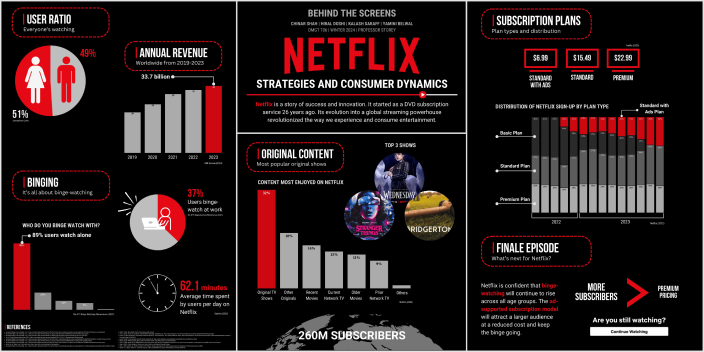
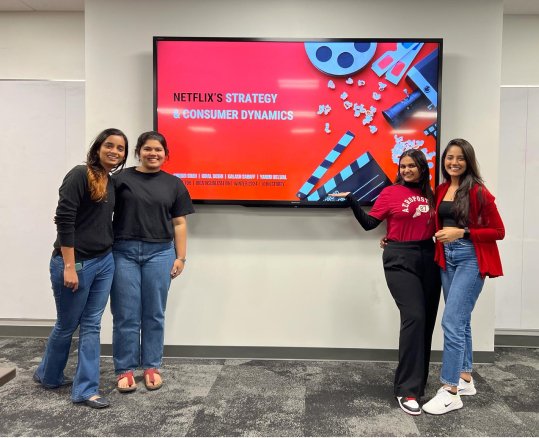
A slide deck was designed which consisted of visuals, graphs, chart and other 2D models. These were re-designed and translated from the key findings during our secondary research.
We utilized efficient diagrammatic and informational presentation techniques to illustrate data and facts, clarify relationships, and craft compelling narratives and captivating proposals.
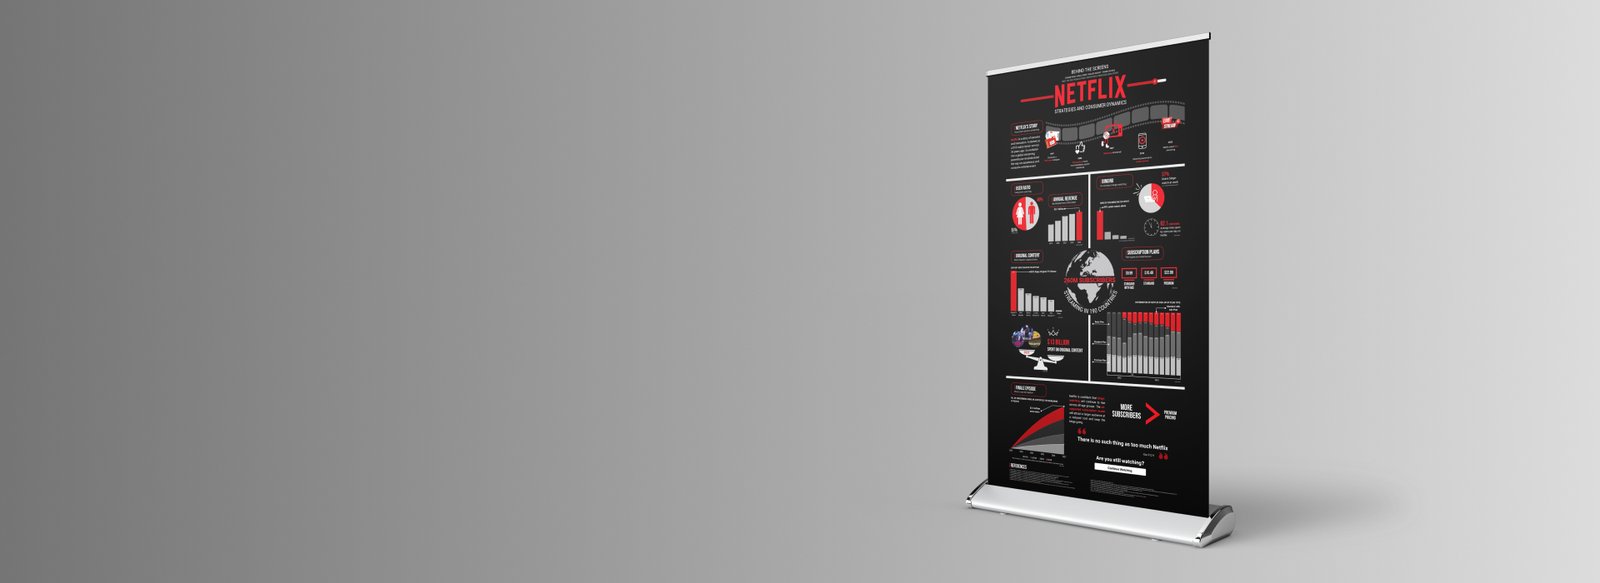
Posters were designed to illustrate data and facts, clarify relationships, and craft compelling narratives and captivating proposals for the company.
A clear hierarchy is ensured to make key information stand out. Visual interest is created and comprehension is improved by grouping related elements and employing contrast, while consistency in design elements is maintained for a cohesive look.

Understand the process.
A comprehensive documentation of the project’s diverse phases is compiled into a process book. It includes a range of activities, research findings, and a detailed account of the process leading to the final outcomes in various formats.